translated by damien from sildes of Sisi Ramanan
Unit 5 Stock Market Bubbles and Investment
1. Asset Return: Facts
-
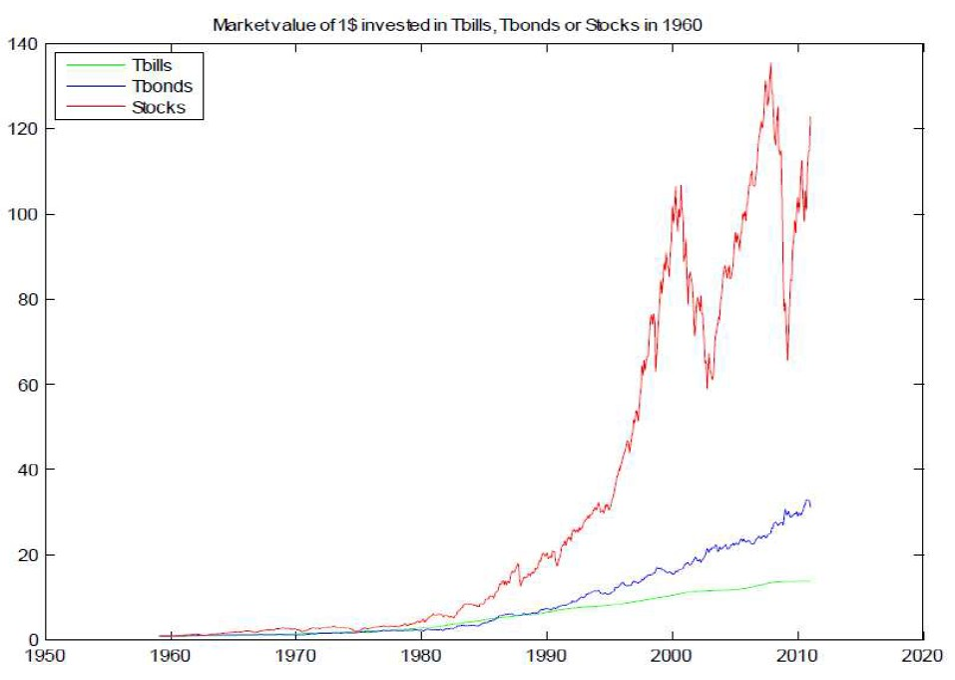
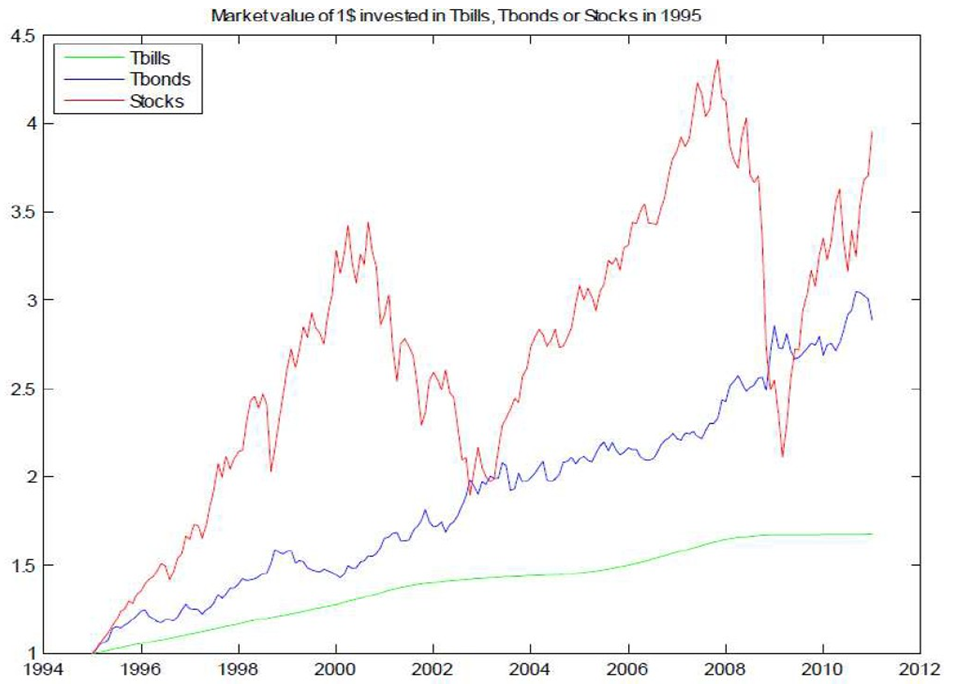
High average stock returns, high volatility of stock returns.
股票平均收益高,股票收益波动性大。 -
Low averge return on bonds (T-bills), low volatility of return on bonds
债券平均回报率低,债券收益率波动性低 -
Based on 1947-2008 real (after-tax) U.S. Data:
基于1947-2008年美国实际(税后)数据:- The expected return on stocks is 8% while for bonds is 1%.
一,股票的预期回报率为8%,而债券的预期回报率为1%。 - The standard deviation of stock returns is 17% while for bonds is 2%.
股票收益率的标准差为17%,而债券的标准差为2%。
- The expected return on stocks is 8% while for bonds is 1%.
Investment and Q
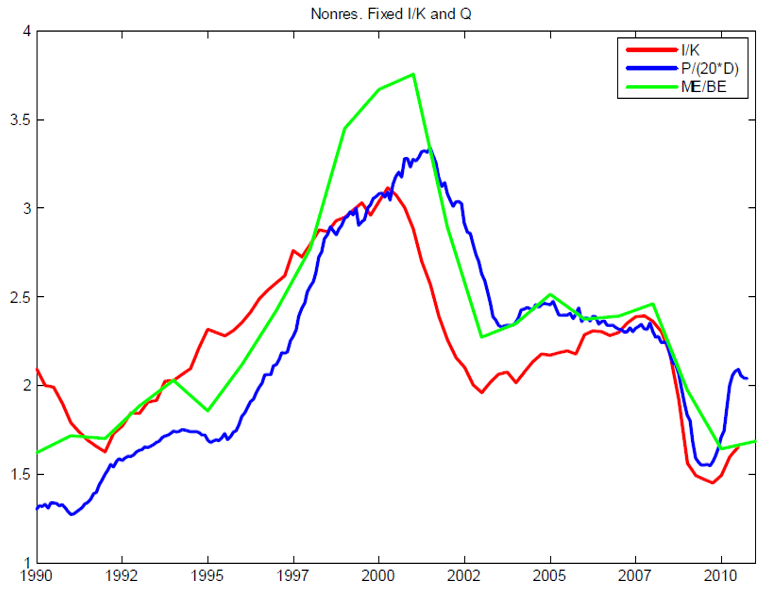

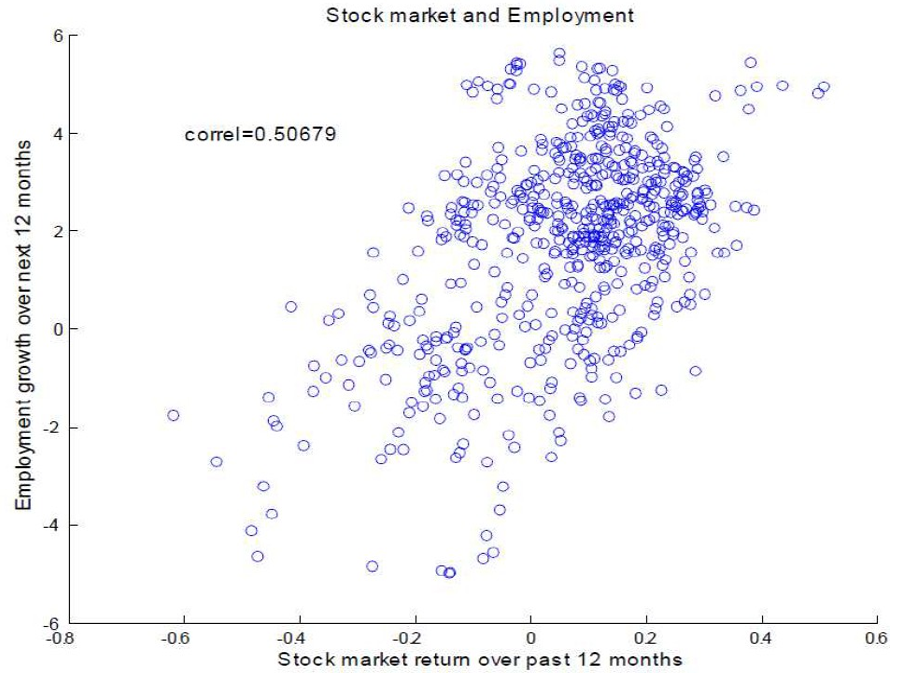
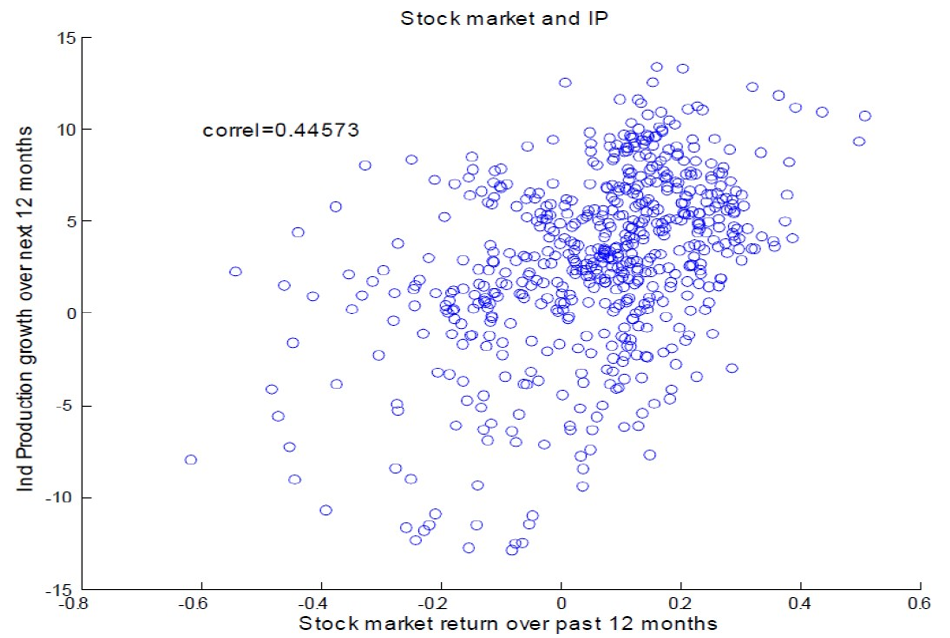
Stock market seems to forecast quite well
股市似乎预测得很好
-
Employment
一,就业 -
Industrial Production
二,工业生产 -
Investment
三,投资
Is all the movement in stock prices due to fundamentals?
If not, why does investment respond to non-fundamental movements?
所有股票价格的变动都是由于基本面因素吗?
如果不是,为什么投资会对非基本面波动做出反应?
What do we mean by non-fundamental movements in stock prices.
Value of firm, \( V\) measures the expected discounted sum of dividends.
A stock is a claim on the value (equivalently assets) of the firm, thus stock price is simply,
股票价格的非基本面变动是什么意思。公司价值,\( V\)衡量预期的股息贴现总额。股票是对公司价值(相当于资产)的主张,因此股票价格很简单,
Thus, in theory all the movement in the stock market is fundamental:
因此,从理论上讲,股市的所有波动都是基本的:
2. Stock Market Bubbles and Investment
Does this equality hold in practice?
Can all of the movements be accounted by fundamentals?
这种平等在实践中是否成立?
所有的变动都能用基本面来解释吗?
Robert Shiller argues NO.
Shiller’s argument is that stock prices contain bubbles.
罗伯特·希勒认为不。
希勒的论点是股票价格包含泡沫。
Consider a stock that pays dividends, dt every period. The fundamental price is then given by:
假设一只股票每一个周期都会派息。基本价格由以下公式给出:
Thus, stock prices should vary closely with dividends.
Shiller in a series of papers published in the early 1980’s finds that stock prices move too much to be justified by changes in dividends.
Dividends were observed to be very stable while stock prices were not.
In general, stock prices were found to deviate from fundamentals.
因此,股票价格应与股息密切相关。
Shiller在1980年代早期发表的一系列论文中发现,股票价格波动太大,无法通过股息的变化来证明其合理性。
股息被观察到非常稳定,而股票价格却不稳定。
总的来说,人们发现股票价格偏离了基本面。
Bubbles can arise from a variety of reasons.
Example: Bias in investor’s beliefs, some investors are optimistic while some others pessimistic.
The question we are interested in is:
泡沫的产生有多种原因。
例:投资者的信念存在偏差,一些投资者乐观,而另一些投资者则悲观。
我们感兴趣的问题是:
“Do stock market bubbles affect corporate investment? ”
“股市泡沫会影响企业投资吗?”
If yes, how can bubbles impact investment?
如果是的,泡沫如何影响投资?
If some firms are financially constrained, a bubble provides an opportunity to issue shares at inflated prices.
New issues of shares at high prices provides additional income.
This new income can be utilitized for investments.
Bubbles can thus relax financial constraints.
如果一些公司财务拮据,泡沫就提供了一个机会,可以以虚高的价格发行股票。
新股发行带来高收益。
这些新收入可以用于投资。
因此,泡沫可以放松金融约束。
3. Campello and Graham empirical study
A clever analysis by Campello and Graham (2007) shows that bubbles affect corporate investment. The question posed is: When is mispricing most likely to affect firm policies and which firms are most likely to respond to mis-pricing ? Campello和Graham(2007)的一个聪明的分析表明,泡沫影响企业投资。 提出的问题是:什么时候错误定价最有可能影响公司政策,哪些公司最有可能对错误定价做出反应?
Campello and Graham (2007) focus their empirical analysis in the 1990s.
The 1990s was viewed as a period of technological revolution.
Innovations in computer software, telecoms, Dot-Com startups such as Google, and in general advancements in data processing and storage.
Campello和Graham(2007)的实证分析集中在20世纪90年代。
90年代被视为技术革命时期。
计算机软件、电信、谷歌等网络公司的创新,以及数据处理和存储领域的普遍进步。
First, there was the so called, “DotCom Bubble”: stock prices in the Nasdaq index rose significantly.
首先,出现了所谓的“网络泡沫”:纳斯达克指数的股价大幅上涨。
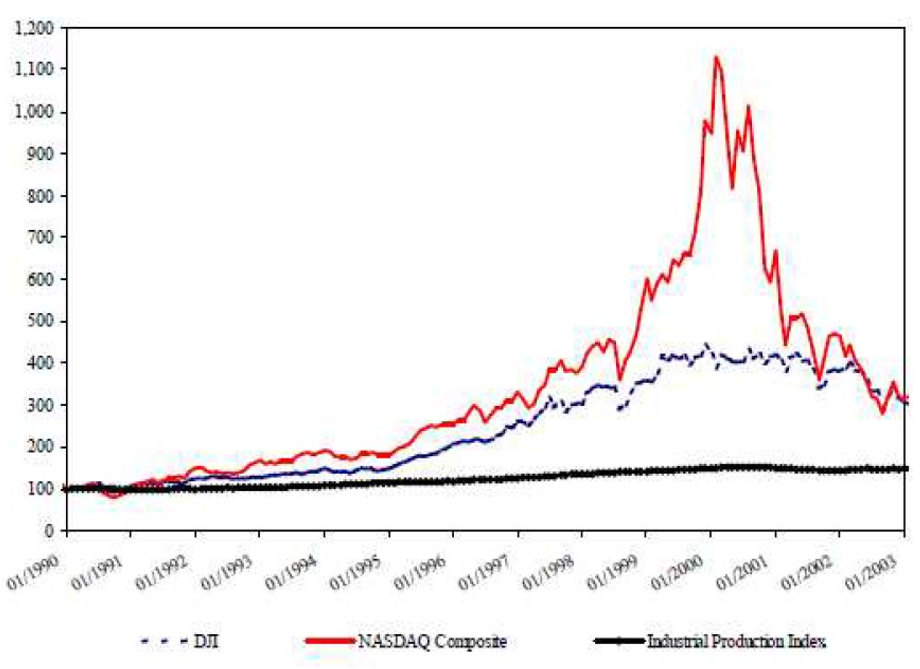
Second, most stock prices (non-tech sectors) indices (notably Dow Jones) rose as well significantly during the decade.
But firms in the Dow-Jones index did not belong in the tech sectors of the economy where the revolution was taking place.
A possibility is that investor’s became overoptimistic about equity investments both in the new and old economy stocks.
其次,大多数股票价格(非科技行业)指数(尤其是道琼斯指数)在这十年中也大幅上涨。
但道琼斯指数中的公司并不属于发生革命的经济体中的科技行业。
一种可能是,投资者对新经济体和旧经济体股票的股票投资过于乐观。
Campello and Graham focus on firms in the non-tech sectors of the economy: There is no reason to expect that they have experienced changes in their fundamentals.
Campello和Graham关注的是经济中非科技行业的公司:没有理由期望它们的基本面发生了变化
The empirical strategy is to regress firm investment on
实证策略是对企业投资进行回归分析
- A standard proxy for firm market value (\(Q ^{Mkt} \))
一,公司市值(\(Q ^{Mkt} \))的标准代表 - The projection of firm market value on firm and industry fundamentals such as past profitability and sales growth (\(FundQ\)).
二,企业市场价值对企业和行业基本面(如过去的盈利能力和销售增长)的预测(\(FundQ\)) - Look at subsets of financially unconstrained and constrained firms.
三,看看财务上不受约束和约束的公司的子集
The basic idea is that once one expunges publicly-available information about capital productivity (\(FundQ\) from market prices (\(Q ^{Mkt} \)), the remainder should have no explanatory power over firm investment, unless misvaluation affects firm decisions.
其基本思想是,一旦一个人从市场价格(\(Q ^{Mkt} \))中删除了关于资本生产率(\(FundQ\)的公开信息,那么剩下的信息对企业投资就没有解释力了,除非估值错误会影响公司的决策。
Main Result
主要结果
While the non-fundamental component of prices has no effect on the investment of unconstrained non-tech manufacturers, the effect of mis-pricing on the investment of constrained non-tech manufacturers is positive and strong during the tech bubble.
当价格的非基本成分对无约束的非技术制造商的投资没有影响时,在技术泡沫时期,错误定价对受约束的非技术制造商的投资的影响是积极和强烈的。
The result is consistent with the hypothesis we articulated earlier: stock market bubbles shift investment spending towards financially constrained firms.
这一结果与我们先前提出的假设是一致的:股市泡沫将投资支出转向财务拮据的企业。
Data and Analysis
数据与分析
Identify non-tech/ non-bubble sectors: energy, steel, mining, chemicals, paper, food and tobacco.
鉴别非技术/非泡沫行业:能源、钢铁、矿业、化工、造纸、食品和烟草。
Non-bubble Sectors: Industrial sectors whose business fundamentals were likely not directly affected by the advances in telecommunications and data processing of the late 1990s.
非泡沫行业:其业务基本面不可能直接受到1990年代后期电信和数据处理进步影响的工业部门
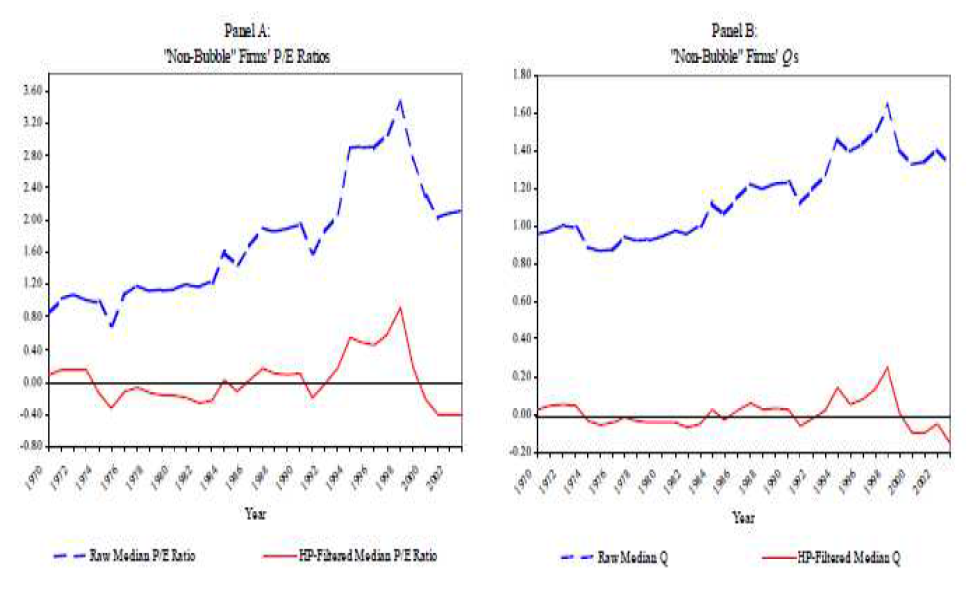
Look at historical data of price-earnings ratio and firm level q (1970 onwards). The series show that during the 1990s valuations deviate from the historical average.
看看市盈率和公司水平q(1970年以后)的历史数据。该系列数据显示,上世纪90年代的估值偏离了历史平均水平。
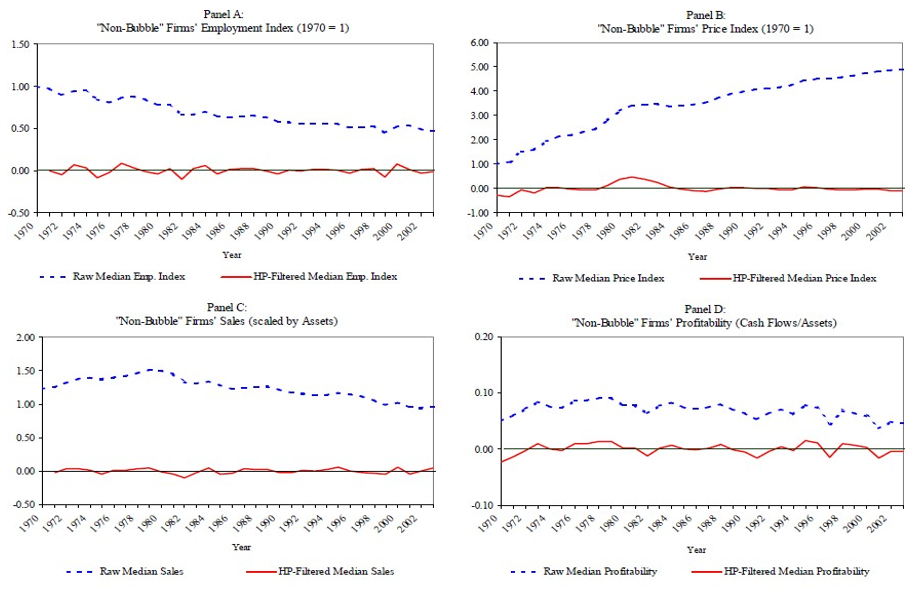
Now look at business fundamentals.
Industry and firm-level data on employment, prices, sales and profitability over the last three decades to check whether these fundamental indicators change around the 1990s tech bubble.
No evidence that fundamental was significantly changing during the bubble period.
现在看看商业基本面。
过去三十年的行业和企业层面的就业、价格、销售和盈利能力数据,以检验这些基本指标是否在1990年代科技泡沫时期发生变化。
没有证据表明基本面在泡沫时期发生了显著变化。
Classify firms in a way that identifies samples of financially constrained vs. unconstrained.
Several classifications: dividends, size, bond rating.
The baseline regression is of the form:
对公司进行分类,确定财务约束和无约束的样本。
几个分类:股息,规模,债券评级。
基线回归的形式如下:
Dummy variables \(firm_i\) and \(year_t\) to capture idiosyncratic variations at the firm level and time variations, respectively.
虚拟变量\(firm_i\)和\(year_t\)分别用于捕获公司层面的特殊变化和时间变化。
They first estimate this regression model on a panel dataset of firm variables observed over 30 years.
他们首先在观察了30年的企业变量的面板数据集上估计了这个回归模型。
Result: Fundamentals drive investment.
This result is consistent with the Investment-Q theory.
They find no evidence that mis-pricing affects investment.
结果:基本面推动投资
这一结果与投资Q理论是一致的。
他们没有发现错误定价影响投资的证据。

They then estimate a second regression of the form:
他们然后预估了第二个回归形式:
\(Bubble_t\) is an indicator variable that takes value 1 during periods when there is a bubble and 0 when there is no bubble.
\(Bubble_t\)是一个指示符变量,在有泡沫时取1,在没有泡沫时取0。
This regression focuses on the 1990s when the DotCom bubble was observed.
这种回归集中在90年代互联网泡沫被观察到的时候。
The idea behind regression equation \eqref{second} is that . . .
if manufacturers respond to Bubbles, the estimated coefficient \( \hat{a _5} \) should be positive and statistically significant.
This is exactly what they find.
回归方程 \eqref{second} 背后的想法是…
如果制造商对泡沫作出反应,估计的系数\( \hat{a _5} \) 应该是正的,并且具有统计学意义。
这正是他们找到的。
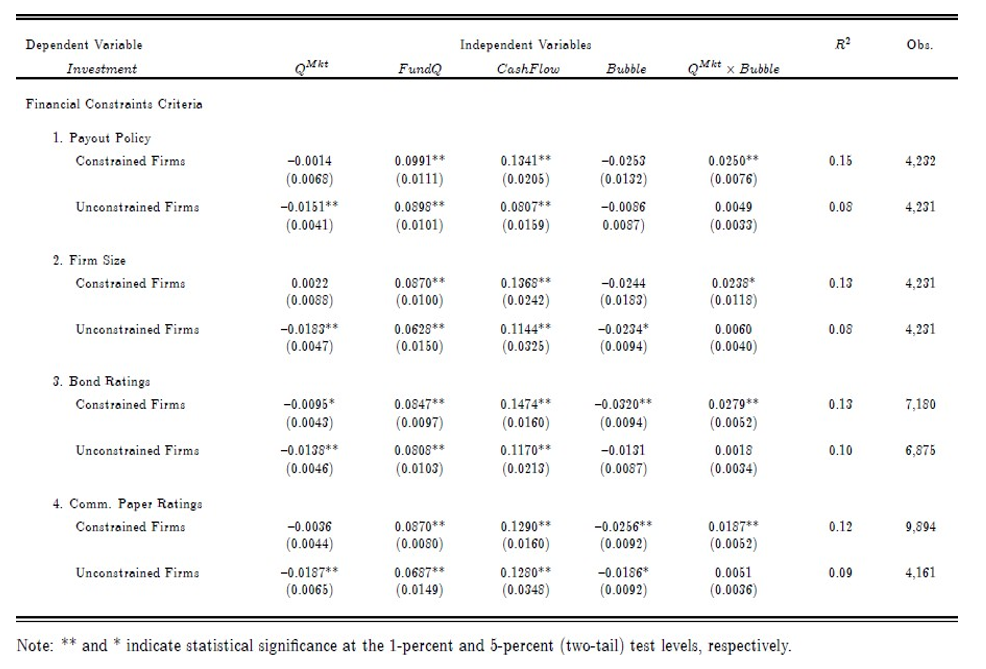
The estimates imply that the impact of mispricing on the investment of constrained firms was quite pronounced during the Bubble period but not outside of that period.
For constrained firms, \( \hat{a _5} \) is positive and statistically significant.
The impact of market valuation, given by \( \hat{a _1} + \hat{a _5} \) is positive and statistically significant at better than the 5% test level across all constrained partitions.
这些估计表明,错误定价对受约束企业投资的影响在泡沫时期相当明显,但在泡沫期之外则不明显。
对于受限制的公司,\( \hat{a _5} \)是正的,并且具有统计学意义。
由\( \hat{a _1} + \hat{a _5} \)给出的市场估值的影响是积极的,并且在统计上显著优于所有受限分区的5%测试水平。
Sharp contrast with the financially unconstrained firms, the bubble has no impact on the relation between valuation and investment for unconstrained firms.
Similar findings are also reported by Gilchrist, Himmelberg and Huberman (2005).
与财务自由公司形成鲜明对比的是,泡沫对无约束公司的估值与投资关系没有影响。
Gilchrist、Himmelberg和Huberman(2005)也报告了类似的发现。
Further Reading
- Campello and Graham 2007, ”DO STOCK PRICES INFLUENCE CORPORATE DECISIONS? EVIDENCE FROM THE TECHNOLOGY BUBBLE”, NBER.